Your browser has turned off or is blocking Javascript.
If you are using a content blocker, check to see that you have not globally turned off Javascript.
If you have turned it off manually in your browser, please enable it to better experience this site.
Our Mission
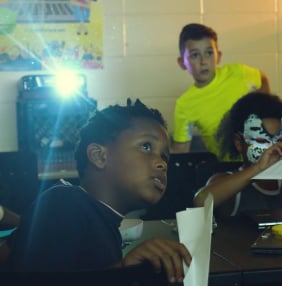
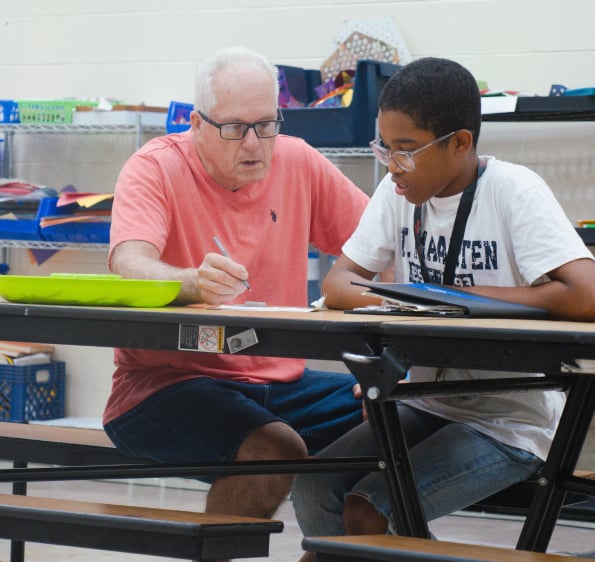
Boys & Girls Clubs of Indianapolis believes every young person deserves to live a life filled with hope and opportunity. Because we care about our young people, we provide a safe, educational and positive atmosphere where they can prosper and reach their full potential.
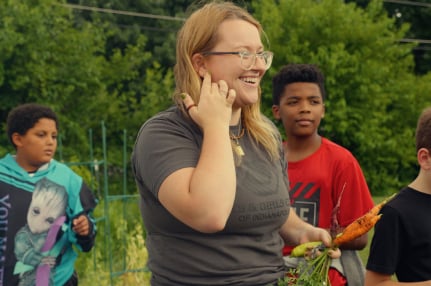
Building Great Futures for the youth in our city!
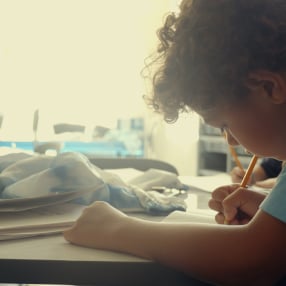
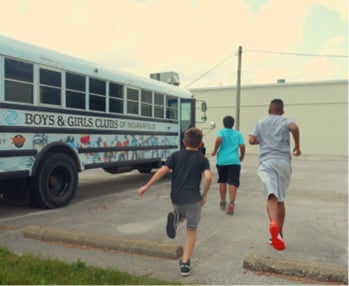
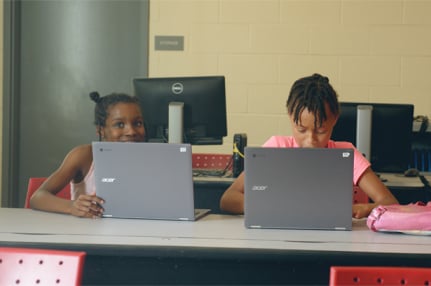
When the school bell rings for the end of the day, many Indianapolis youth are left with few options for positive after-school activities. Some are at home with no adult care or supervision, not because they do not have great caretakers, but because caretakers must work long hours to support their families. Young people need to know that someone cares when guardians cannot be there.
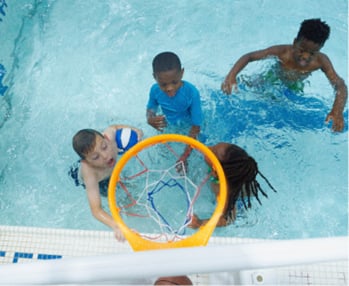
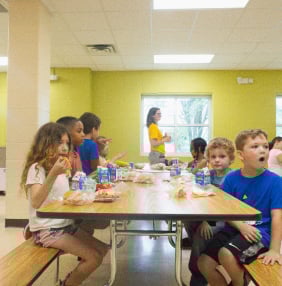
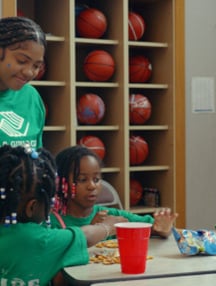
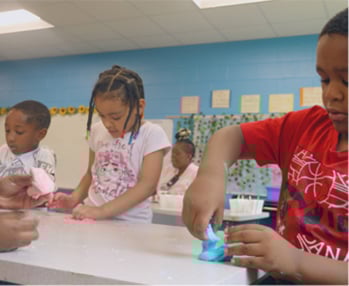
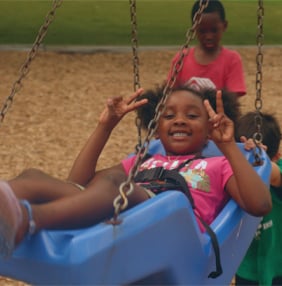
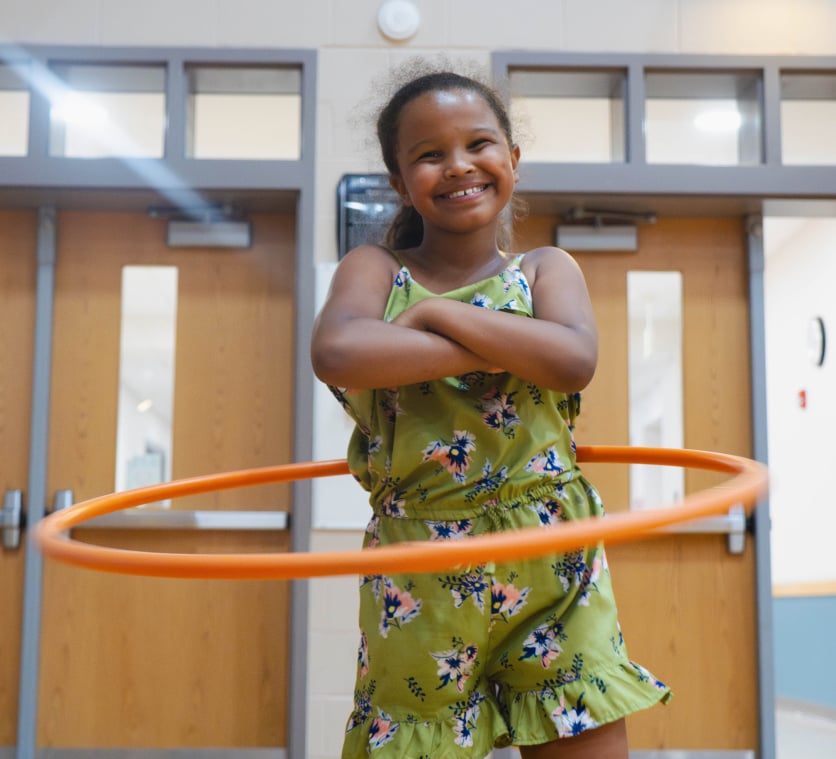
The Clubs are a safe place to learn and grow – all while having fun. It is a place where Great Futures are started each and every day.
We will put kids first by being mindful of the many issues youth face today. We will be supportive; proactive; engaging; passionate; focused; and committed to providing quality services.